Plot in Python, Visualization wtih pyvis
Books & Docs #
- Seaborn tutorial & gallary
- OReilly 2017 - [easy to find common examples] Python Data Science Handbook
- Packt 2015 - [nice code grammar] Python Data Visualization Cookbook, 2nd Ed. (Igor Milovanovic)
- Packt 2015 - [rich & various content] Mastering Python Data Visualization
- Packt 2015 - [advanced nice plots & deployments] Mastering matplotlib (D.M. McGreggor)
- [Very bad composition] Packt 2018 - Matplotlib for Python Developers - 2nd Ed (by Allen Yu, Claire Chung)
Overview of Libs #
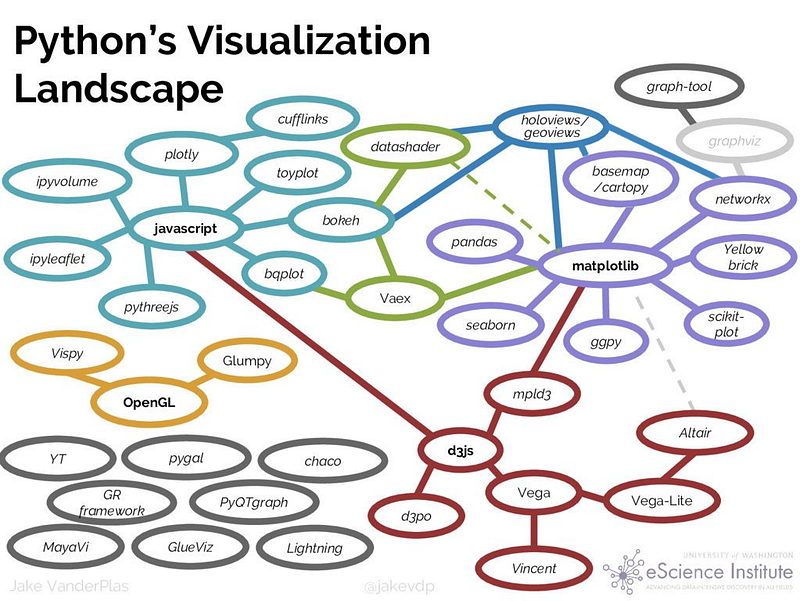
Python Data Visualisation Landscape
Python Data Visualisation Landscape w/ PyViz (PyViz Ecosystem)
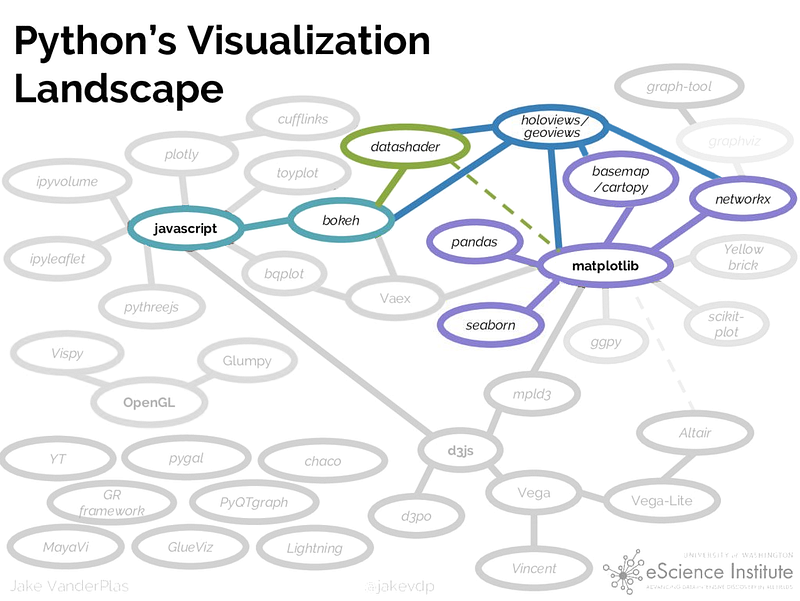
Some of the important goals of PyViz are:
- Emphasis should be on data of any size not coding
- Full functionality and interactivity should be available right in the browsers(not desktops)
- The focus should be more on people who are Python users and not web programmers.
- Again focus should be more on 2D viz more than 3D.
- Exploitation of general -purpose SciPy/PyData tools with which the Python users are already familiar
Ref by kdnuggets: PyViz: Simplifying the Data Visualisation Process in Python
